In this paper, we undertake a mathematical investigation of 20 countries to answer three questions in relation to the evolution of the COVID-19 pandemic, the real economy and the financial economy. We study three multivariate time series measuring country’s daily mobility data, daily COVID-19 cases, and financial index performance. First, we analyse wIn this paper, we undertake a mathematical investigation of 20 countries to answer three questions in relation to the evolution of the COVID-19 pandemic, the real economy, and the financial economy. We study three multivariate time series measuring a country’s daily mobility data, daily COVID-19 cases, and financial index performance. First, we analyse which countries behave similarly with respect to each of these features independently. Second, all countries’ trajectories are studied in conjunction to determine if any two candidate features exhibit more pronounced similarity. We demonstrate that mobility data and financial indices exhibit the most similarity in their trajectories. Finally, we study whether there is a difference in the time taken for COVID-19 cases data to be reflected in financial index performance and economic activity. A new optimisation method is introduced which demonstrates that mobility data tends to lag financial market performance, highlighting greater efficiency among financial market participants than governments in considering and acting upon new COVID-19 data. This finding suggests that studying mobility data as a leading indicator for financial market performance during the pandemic was, at least in the short-term, misguided.
During the pandemic there was a surge of interest in alternative data among the investment management community. One of these data sources was Apple mobility data. The basic hypothesis here, was that mobility data may be a leading economic indicator and provide insights into the probable movement of financial indices. The initial motivation for this stuDuring the pandemic, there was a surge of interest in alternative data among the investment management community. One of these data sources was Apple mobility data. The basic hypothesis here, was that mobility data may be a leading economic indicator and provide insights into the probable movement of financial indices. The initial motivation for this study sought to determine whether such mobility data provided any use to investment managers in their estimating future performance of respective financial indices. The countries included in this study are Argentina, Australia, Brazil, Canada, Denmark, France, Germany, India, Italy, Japan, Mexico, the Netherlands, New Zealand, Norway, Russia, Singapore, Spain, Switzerland, the UK, and the US. For each country, we analyse three time series (COVID-19 new cases, financial index performance, mobility data). Our analysis uses data starting 1/1/2020 and ending 30/12/2020. The data sources are Bloomberg, Apple Mobility, and Our World in Data.
In this section we study the independent behaviours of COVID-19 new cases, mobility activity and financial index pIn this section, we study the independent behaviours of COVID-19 new cases, mobility activity, and financial index performance among our 20 countries of interest. In each section, we generate a distance matrix between the normalised trajectories of each country’s respective feature. We apply hierarchical clustering to each distance matrix to study the groupings and candidate similarity among countries. A summary of clustering results is below.
COVID-19 cases
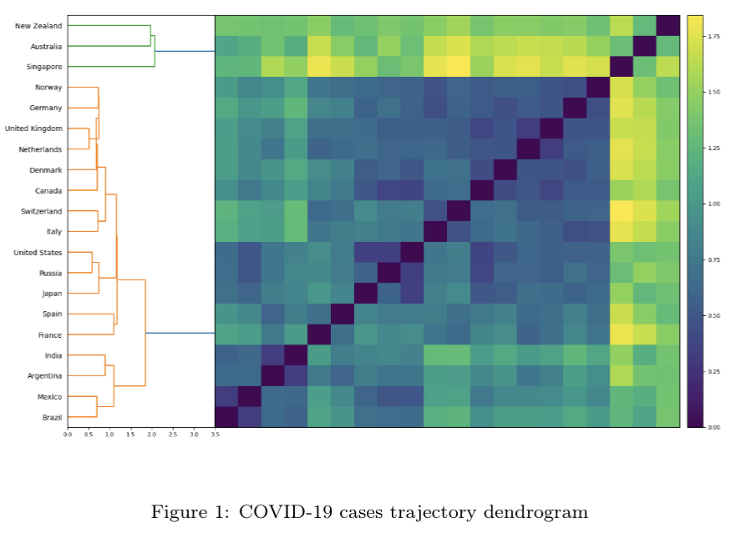
The COVID-19 cases trajectory dendrogram is comprised of 2 clusters, a large predominant cluster and a small cluster oThe COVID-19 cases trajectory dendrogram is comprised of two clusters, a large predominant cluster and a small cluster of anomalous outliers, namely New Zealand, Australia, and Singapore. The larger cluster is characterised by new case trajectories exhibiting multiple waves of new cases, with many countries experiencing growth in cases toward the end of 2020. The common theme among the countries in the anomalous cluster is their low total number of cases throughout 2020, and their suppressed growth in cases toward the end of 2020.
Mobility activity
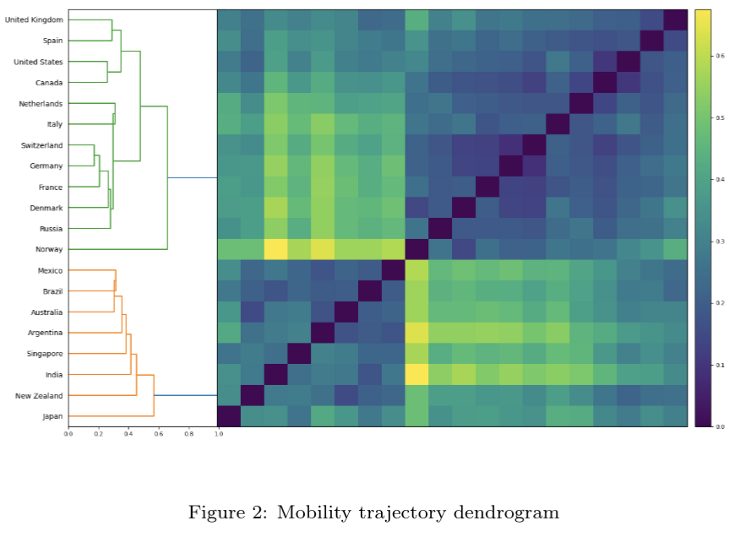
The mobility activity trajectory dendrogram is comprised of two more equally-sized clusters. The first cluster includes Mexico, Brazil, Australia, Argentina, Singapore, India, New Zealand, and Japan. Mobility trajectories within this cluster are consistently increasing (or, in select instances, flat) among these countries. These trajectories are representative of countries that experienced waves of COVID-19 cases earlier in 2020, imposed restrictions to reduce case numbers, and gradually reopened their economies. The second cluster consists of the UK, Spain, the US, Canada, the Netherlands, Italy, Switzerland, Germany, France, Denmark, Russia, and Norway. All mobility trajectories for countries within this cluster possess declining trajectories in their mobility. This is almost certainly due to government restrictions in respective countries, which were in response to significant growth in COVID-19 cases and deaths. Interestingly, the two clusters exhibit geographical affinity. The first cluster consists of countries in South America and Oceania, while the second cluster comprises European and North American countries. This highlights the similarity in the timing of lockdowns among many countries in proximal geographies.waves of COVID-19 cases earlier in 2020, imposed restrictions to reduce case numbers, and gradually reopened their economies. The second cluster consists of the United Kingdom, Spain, the United States, Canada, the Netherlands, Italy, Switzerland, Germany, France, Denmark, Russia and Norway. All mobility trajectories for countries within this cluster possess declining trajectories in their mobility. This is almost certainly due to government restrictions in respective countries, which were in response to significant growth in COVID-19 cases and deaths. Interestingly, the two clusters exhibit geographical affinity. The first cluster consists of countries in South America and Oceania, while the second cluster comprises European and North American countries. This highlights the similarity in the timing of lockdowns among many countries in proximal geographies.
Financial index performance:
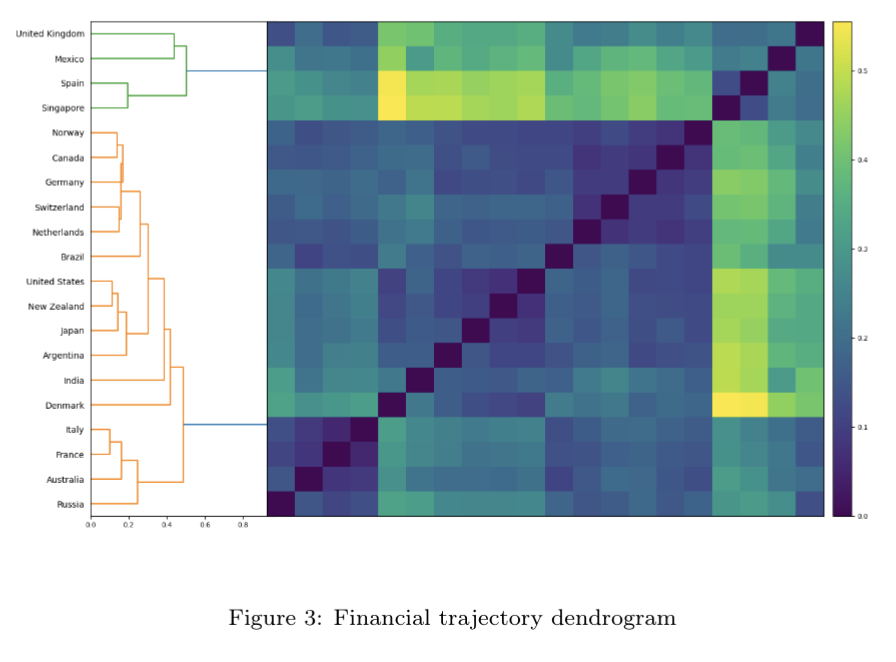
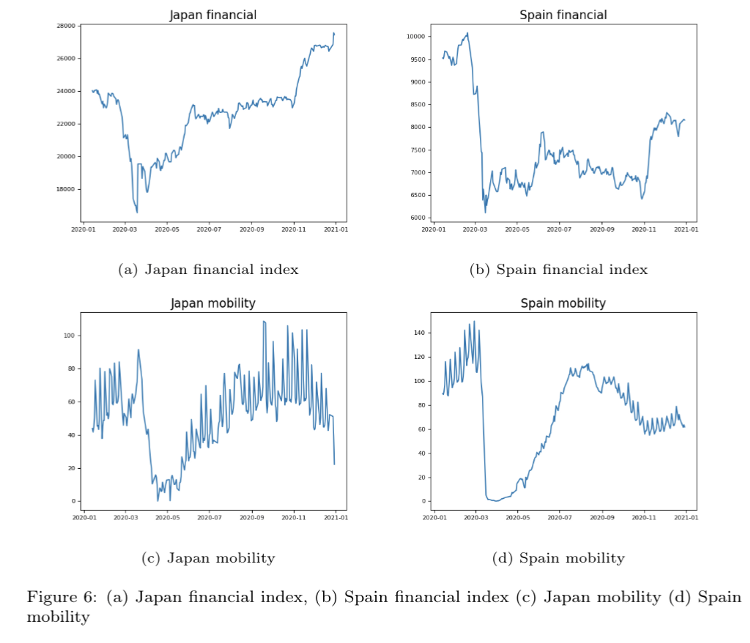
The financial trajectories dendrogram consists of two clusters, a primary cluster and a smaller anomalous cluster. The anomalous cluster consists of the UK, Mexico, and Singapore. The outlier cluster is comprised of countries that share similar financial index trajectories. Specifically, there is a large drop in March, a subsequent drop in November, and a slight to moderate recovery during the latter half of November and December. Interestingly, all these countries’ financial indices finish 2020 at a level lower than their pre-COVID position. The dominant cluster which consists of the remaining countries, exhibits far fewer uniform trajectories. However, many countries in the dominant cluster experienced more substantial recoveries than the anomalous cluster. For instance, the US and New Zealand (which possess highly similar trajectories) both post consistent gains after their precipitous drops in March.
Trajectory associations and interplay
The preceding analysis highlights several noteworthy points regarding the consistency in country cluster behaviours in reference to the above features.
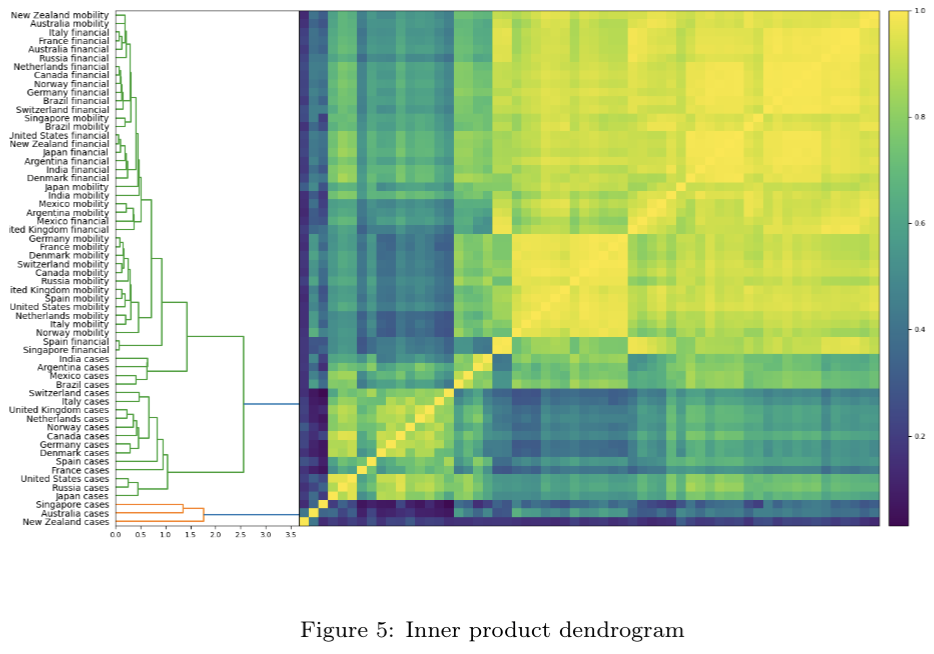
Next, we seek to determine collective similarity among country attributes that we have studied. To do so, we generate a 60 x 60 matrix measuring the normalised inner product between all attributes’ trajectories and apply hierarchical clustering to the resulting distance matrix. The results can be seen in Figure 5. There is obvious structure in this dendrogram. Financial and mobility activity trajectories are highly similar, while COVID-19 case trajectories are significantly less similar. This makes sense. Both the mobility and financial index trajectories exhibit similar shapes; there is generally a sharp drop around March, followed by a subsequent recovery in activity and gains respectively. COVID-19 cases on the other hand exhibit dissimilar trajectories. First, COVID-19 case trajectories between countries are much more dissimilar—influenced by many factors such as the government’s willingness to enforce restrictions, the restriction of travel and human movement, etc. Second, COVID-19 case trajectories are prone to “wave” behaviour, where there may be multiple peaks and troughs throughout the evolution of a country’s 2020 case numbers. Interestingly, there is no tendency for trajectories to be grouped based on country. For example, the Japan COVID-19 cases, financial index performance, and mobility trajectories do not cluster similarly. Given the collective phenomenology, one would naturally wish to understand whether COVID-19 cases impact financial indices or mobility activity first—and whether this varies among countries.
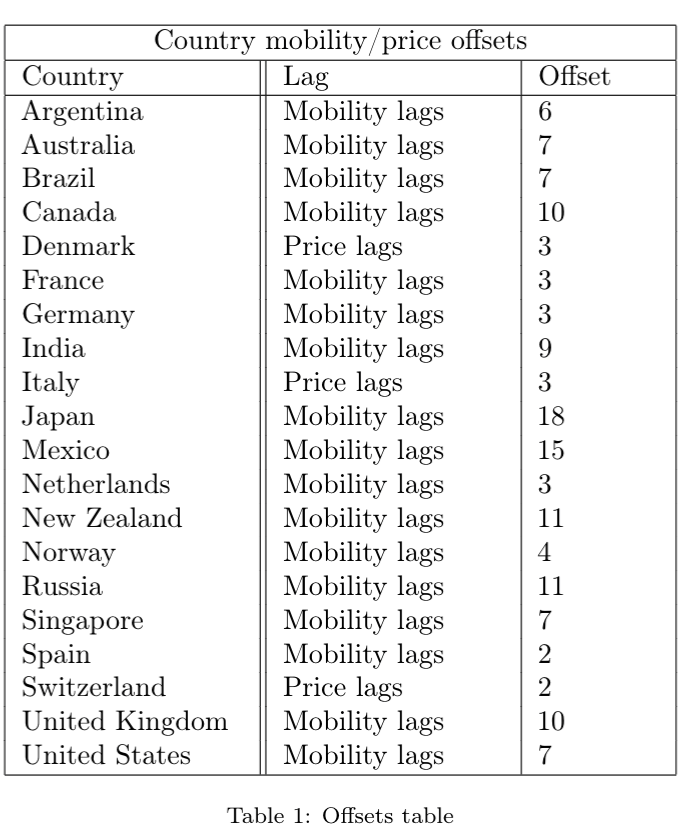
Given the similarity in the behaviour of mobility activity and financial index performance, we now compare the efficiency of governments and financial market participants in their use of COVID-19 data for decision-making. To do so, we introduce a new inner product-based optimisation framework, where the objective function is to estimate an offset between any two trajectories such that their inner product is maximised. Effectively, this aligns the major peaks and troughs in any two candidate trajectories. In this model, we assume that either mobility activity or financial index performance may be the laggard. The offset results displayed in Table 1 reveal several findings.
All studies have their limitations, and this one is no different. Our analysis could be improved in several ways. First, one could study more granular financial and mobility data. It is possible that in analysing data that is aggregated at the country and financial index level respectively, we may be ignoring subtleties in the data and may fail to capture important relationships.
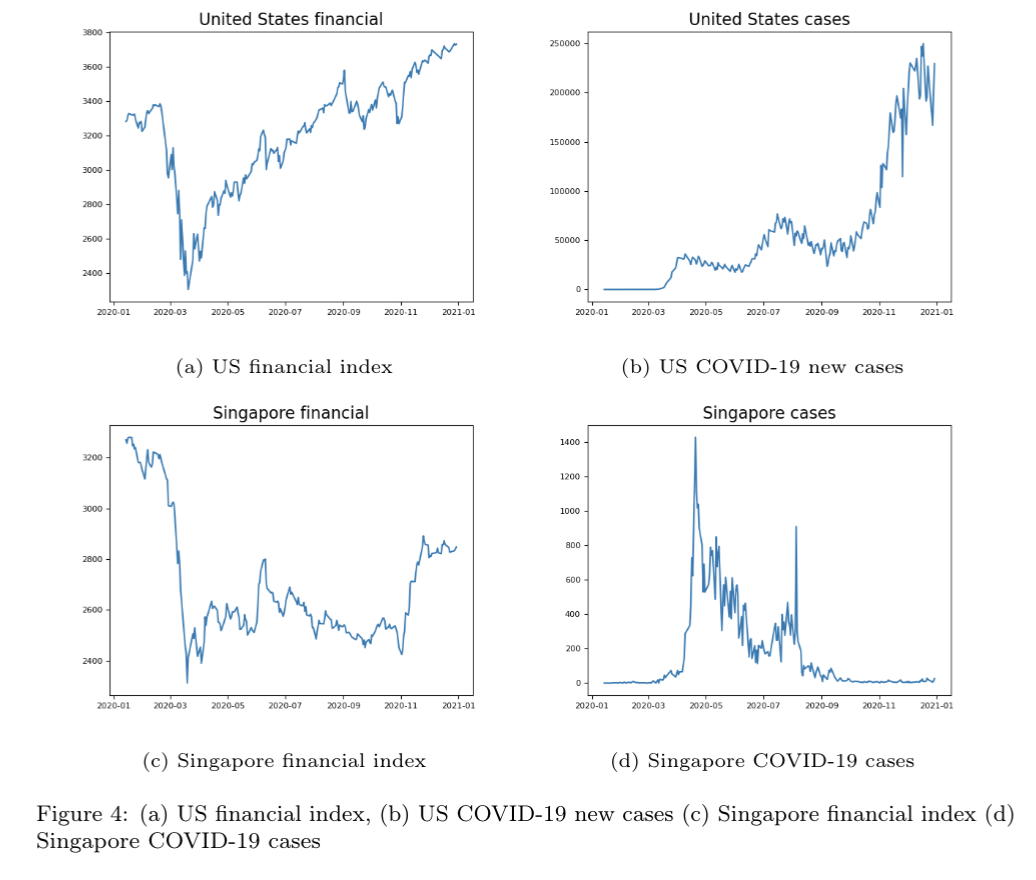
There are several interesting findings in this work. First, we demonstrate that there is very little consistency in cluster behaviours or constituents when studying the trajectories of COVID-19 cases, mobility activity, and financial index performance. This was most clearly evidenced by Singapore, who managed their COVID-19 case numbers particularly well and had particularly weak performance in its financial index. By contrast, while the US experienced huge COVID-19 case and death numbers, the country index produced strong performance after the market crash in March. Next, we demonstrate that financial index and mobility trajectories are most similar, with no tendency for trajectories to be grouped around their respective countries. Having established this similarity, our new optimisation method demonstrates that mobility trajectories generally lag financial index trajectories. This suggests that throughout the pandemic, financial market participants incorporated COVID-19 case numbers into their trading decisions faster than governments were able to act on this information by way of instituting restrictions.
I have tried to keep mathematical notation to a minimum for the sake of readability. If you have any questions related to the above article, please feel free to contact me at [email protected]