In this paper, we study the behaviours and similarity profile of country financial indices, sector financial indices, and equities over the past 20 years.
First, we introduce a new methodology to determine the similarity of 20 countries and 11 sectors with respect to their time series’s structural breaks. We introduce a new metric that can quantify distance between any two candidate sets, where a probability distribution determines the uncertainty surrounding the locations of various elements. Next, we turn to US equities, where we administer three separate experiments. First, we analyse the evolution of equity crisis correlations over time, highlighting the increase in equity similarity in recent years, and in times of market panic. Next, we investigate the collective similarity of equity trajectories over time and demonstrate greater distance between trajectories during times of crisis. Finally, we explore the dynamics of our equity market collection, via a time-varying principal component analysis. We highlight current areas of difficulty in spreading investments among assets exhibiting homogenous behaviours, and suggest approaches that may improve investor diversification.
Motivation of this study
In March-June 2020, global markets exhibited extreme behaviours due to the COVID-19 crisis. Investors struggled amidst declining asset prices and volatility, as many "traditional" diversification strategies did not appear to be effective. In fact, intra-asset correlations seemed to be particularly high—even relative to previous market crises. This triggered our curiosity, and we thought it warranted a thorough investigation.
Despite the wealth of data available to financial market participants, there is a tendency for many investors to focus on the recent past. This is sensible. Market dynamics are continuously changing, and although history may rhyme, it certainly doesn’t repeat itself and financial market behaviours in 2020 are most unlikely to be identical to those in 2000 as many aspects of financial markets have altered substantially over the past two decades.
This paper is written with a different purpose. We wish to study how country, sector, and equity behaviours have evolved over the past 20 years—especially during times of crisis. We introduce new methodologies to examine changes in erratic behaviours, trajectories, and time-varying dynamics.
We break our analysis into two parts. First, we study the similarity in structural breaks among countries and sectors. This analysis could be useful for any asset allocator or investor looking to diversity their investments with respect to country or sector exposure. Second, we study S&P 500 equities, and explore the evolution of correlations, trajectories, and time-varying dynamics. Insights from this work could be used by any global equity investor interested in the dynamic phenomenology exhibited by equities over the past 20 years.
Data
Our country and sector data spans 4/1/2002–8/10/2020 and 4/1/2000–8/10/2020 respectively, and measured daily. The countries we analyse include Australia, Brazil, Canada, China, France, Germany, India, Indonesia, Italy, Japan, Korea, the Netherlands, Russia, Saudi Arabia, Spain, Switzerland, Turkey, the UK, and the U. The sectors we analyse include Communications, Consumer Discretionary, Consumer Staples, Energy, Financials, Healthcare, Industrials, Information Technology, Materials, Real Estate, and Utilities. Our equity data spans 3/1/2000–8/10/2020. We study all S&P 500 equities in existence from the date of inception until the end of our analysis window. This leaves us with 347 equities, and all our data is sourced from Bloomberg.
Erratic behaviour modelling
In this section, we study the similarity in the erratic behaviours of 20 country indices and 11 financial market sectors. To determine similarity, we apply a change point detection method to each time series and generate sets of change points. Importantly, we use a methodology that detects change points based on changes in the power spectrum. This alleviates issues that many change point detection methodologies face when confronted with dependent data. Prior work has demonstrated that the methodology applied in this paper appropriately detects change points in piecewise autoregressive processes, highlighting the algorithm’s ability to partition dependent data. For those interested in the methodologies applied, please see one of the following papers:
As dependence is often the case in financial time series, we use the aforementioned technique. This methodology is implemented in a Bayesian framework, and captures uncertainty around candidate change points. We adjust a previously introduced semi-metric to account for uncertainty surrounding candidate change points when measuring distance between sets.
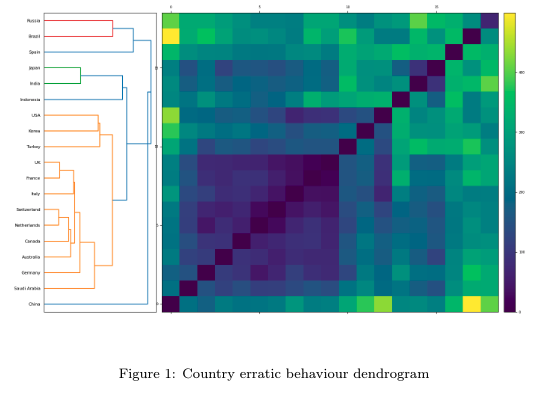
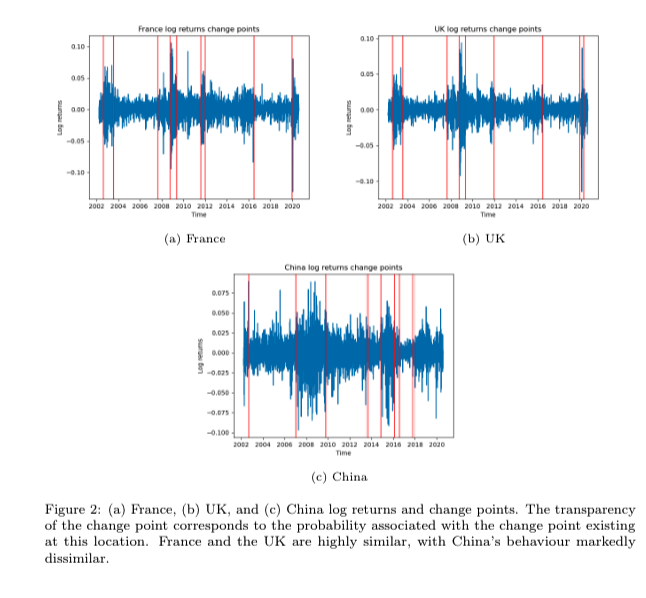
The erratic behaviour cluster structure of the country financial indices suggests that there is one predominant cluster of countries and several other diffuse clusters. The primary cluster consists of Korea, Turkey, France, Italy, Switzerland, Netherlands, Canada, Australia, Germany, Saudi Arabia, the UK, and the US. The collection of outlier countries includes Russia, Brazil, Spain, and China. These cluster memberships and associated change points may be due to substantial similarity in the geographic location and political association of such countries, leading to similar market behaviours during events such as Brexit. Notably, Spain is determined to be markedly less similar than its European counterparts. The most anomalous country within the collection is China. This is unsurprising, as many of the idiosyncratic restrictions related to their local equity market may provide different dynamics to those exhibited by other financial markets.
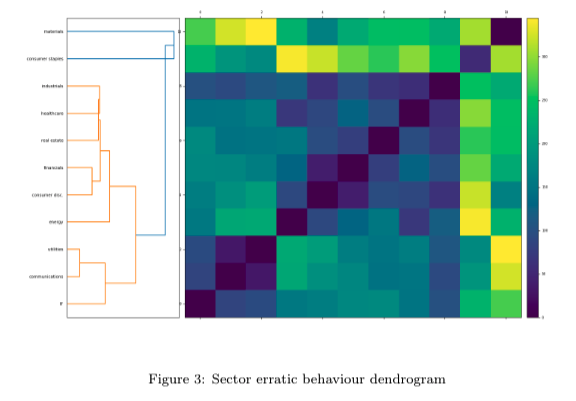
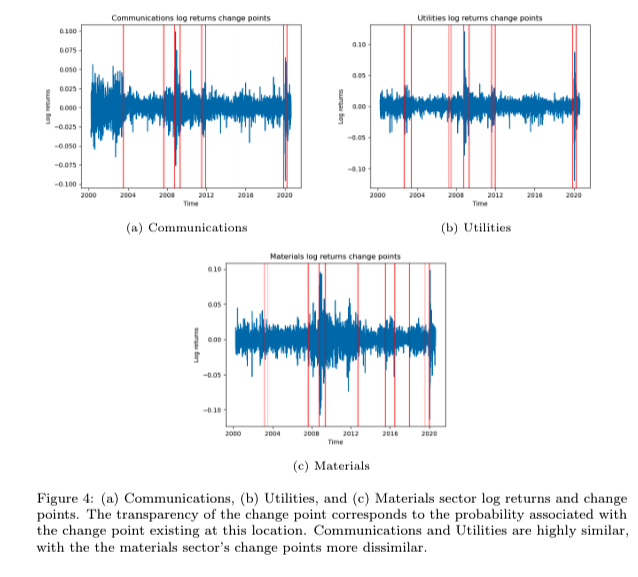
The sector erratic behaviour dendrogram consists of 2 clearly separated clusters. The primary cluster consists of all stocks The sector erratic behaviour dendrogram consists of two clearly separated clusters. The primary cluster consists of all stocks except materials and consumer staples. Interestingly, the utilities, communications, and IT sectors exhibit no structural breaks in the period between 2012–2019. By contrast, several change points are detected in the materials sector time series during this time window. Change points are also detected between 2012–2019 in the sector time series within the predominant cluster (financials, consumer discretionary, etc.). Figure 4 displays the log returns and detected change points for the communications, utilities, and materials sectors. One can see the stark difference in the propagation of structural breaks in the period between 2012–2019.
To compare the degree of similarity between countries and sectors, we compute the matrix norms of our erratic behaviour matrices, and normalise them by the number of elements in the matrix (as there is a different numbers of countries/sectors in our previous experiments). The country erratic distance matrix norm is higher than the sector erratic distancTo compare the degree of similarity between countries and sectors, we compute the matrix norms of our erratic behaviour matrices, and normalise them by the number of elements in the matrix (as there is a different number of countries/sectors in our previous experiments). The country erratic distance matrix norm is higher than the sector erratic distance matrix norm. The smaller value in the sector norm suggests that the erratic behaviour profile is much more similar among sectors than it is among countries. This could suggest that diversification benefits are more substantial to investors diversifying with respect to countries (as opposed to sectors).
In this section, we study 347 US equities over ~ 20 years. We break our analysis into three separate sections. First, we examine the behaviour of correlation coefficients during various discrete (and distinct) time periods. Next, we study the In this section, we study 347 US equities over ~ 20 years. We break our analysis into three separate sections. First, we examine the behaviour of correlation coefficients during various discrete (and distinct) time periods. Next, we study the collective similarity in rolling equity trajectories. Finally, we explore the time-varying eigenspectrum—as a means of highlighting periods in time where the “market effect” is most pronounced (indicated by the size of the leading eigenvalue).
In this section, we partition our analysis window into five periods: GFC, Peak GFC, Interim (the period between the GFC and COVID), COVID, and Peak COVID. The date windows for each time partition are as follows:
Within each period, we compute the correlation matrix for all equities in our collection, and plot the distribution of correlation coefficients.
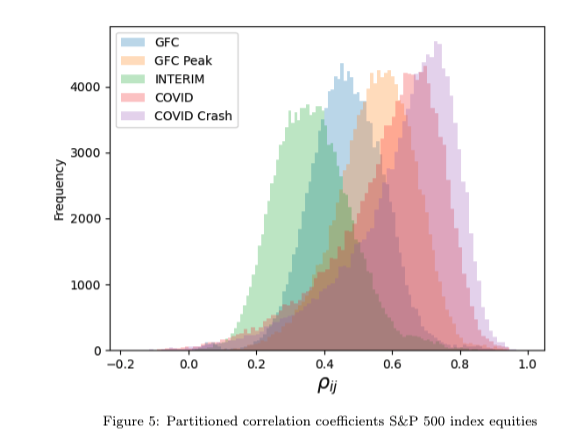
Figure 5 presents two findings. First, there is clearly an increase in the correlation of equities during times of crisis. This is reflected in both the GFC and COVID-19 market crashes, but this spike in correlation is even more pronounced at the peak of these crashes. That is, the Peak GFC and Peak COVID distributions are centred further to the right than the GFC and COVID distributions respectively. Second, this increase in correlations has become more pronounced in recent times. Figure 5 suggests that equity behaviour has become more similar during times of crisis. The implications of this finding are alarming, and suggest that traditional Markowitz-inspired portfolio diversification frameworks have to be altered, at least within the context of pure equity portfolios.Figure 5 presents two findings. First, there is clearly an increase in the correlation of equities during times of crisis. This is reflected in both the GFC and COVID-19 market crashes, but this spike in correlation is even more pronounced at the peak of these crashes. That is, the Peak GFC and Peak COVID distributions are centred further to the right than the GFC and COVID distributions respectively. Second, this increase in correlations has become more pronounced in recent times. Figure 5 suggests that equity behaviour has become more similar during times of crisis. The implications of this finding are alarming, and suggest that traditional Markowitz-inspired portfolio diversification frameworks must be altered, at least within the context of pure equity portfolios.
In this section we study the rolling similarity in equity trajectories. To do so, we normalise all trajectories by their L_1 norm, and compute distances between all candidate trajectories on a 45 day rolling basis. Figure 6 demonstrates that periIn this section, we study the rolling similarity in equity trajectories. To do so, we normalise all trajectories by their L1 norm, and compute distances between all candidate trajectories on a 45-day rolling basis. Figure 6 demonstrates that periods of crisis provide the most heterogeneity in trajectories. In particular, the dot-com bubble, GFC, and COVID-19 market crisis all display spikes in the rolling norm computation.
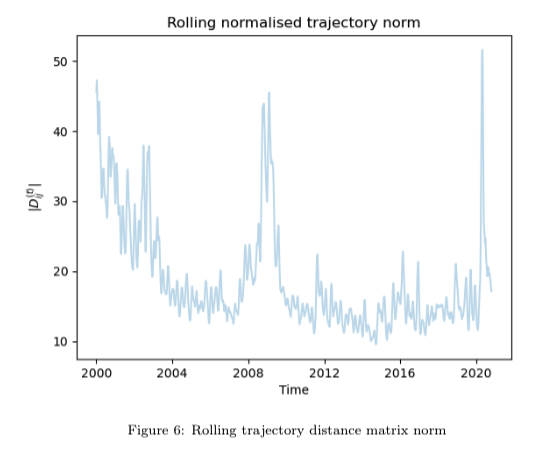
Although there is an increase in trajectory distance matrix norms during periods of crisis, the direction of trajectories is still largely uniform. During crises, the overwhelming direction of equities is downward. The uniformity is confirmed in our correlation analysis, where correlation coefficients are more strongly positive. This is interesting.
Finally, we implement a time-varying principal components analysis, where we plot the percentage of explanatory vaFinally, we implement a time-varying principal components analysis, where we plot the percentage of explanatory variance exhibited by each eigenvector. Given that the first eigenvector represents the collective strength of the market, when there is a spike in the first element of the eigenspectrum, it is indicative of an increase in the strength of collective market behaviours.
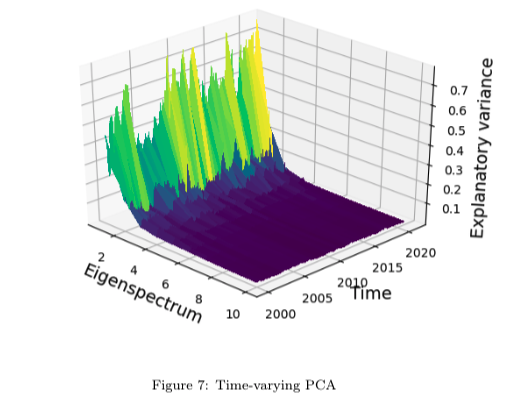
Figure 7 shows spikes in the first element of the eigenspectrum during the dot-com bubble, GFC and the COVID-19 market crisis. This confirms our earlier findings in the study of correlations, indicating that market dynamics are markedly more homogenous during times of crisis.
Our erratic behaviour modelling highlights sectors and countries that behave most similarly and dissimilarly. Of the 20 countries analysed, there is one predominant cluster that consists primarily of European countries. The sector erratic behaviour analysis finds one primary cluster among the 11 sectors analysed. Materials and consumer staples are found to be most dissimilar to other sectors in terms of their erratic behaviours. Our (normalised) matrix norm analysis suggests that it may be more difficult to diversify across sectors than countries. This is highlighted by the larger value for the country erratic distance matrix norm. Our correlation analysis provides two insights. First, equity correlation has increased over time. Second, equity correlation spikes during market crises. Our trajectory analysis and rolling PCA indicates that although trajectories show the most heterogeneity during crises, collective market dynamics are strongest during these periods. Such findings could be of interest to global equities and international investors concerned with understanding market dynamics and diversifying their investment portfolios.
I have kept mathematical discussion/notation to a minimum for the sake of accessibility. For those interested in the mathematical details, please feel free to email me at [email protected]