
EdventureCo is pleased to announce the appointment of Denise Farrell as the new General Manager, Plain English Foundation. EdventureCo is a premium provider of digital, soft, and future skills training, committed to developing lifelong learners for the roles of the future. Denise will be responsible for overseeing the day-to-day operations of the company, continuing to build on the outstanding reputation as Australia’s leading provider of plain English training, consulting, and editing.
Denise’s priority is to support our diverse and inclusive teams to drive innovation and accelerate growth. With a passion for quality customer care, Denise will be supporting our committed teams to deliver exceptional experiences for all our clients. Her aim is to build a strong workplace culture and robust systems so that all employees can excel and reach their potential.
“We are thrilled to welcome Denise to the EdventureCo team,” said Nicola Fowkes, General Manager of the EdventureCo Group. “Her extensive experience, as well as her passion for learning and helping people develop new skills, makes her the perfect fit for our company. We look forward to seeing the positive impact she will have within the group.”
“I am thrilled to join Plain English Foundation. The thought of leading this exceptional team, developing new strategies, and achieving business objectives fills me with excitement and a sense of purpose. I am excited to dive into the challenges of this new role and make a meaningful impact on the company’s success and to create a positive and productive work environment. It is an honour to join a team with such a strong track record, providing hundreds of organisations to improve their writing skills and transform their documents over the last 20 years”.
VivoPower is pleased to announce that the Company and its wholly-owned subsidiary, Tembo e-LV, have entered into a Memorandum of Understanding with leading Indonesian mining solutions provider Petrosea to sell, distribute, and market Tembo electrification conversion for Toyota 4×4 vehicles and/or 4×4 Toyota vehicles which have been fully electrified by Tembo.
Under the proposed agreement, Petrosea would commit to selling 2,000 Tembo e-LV conversion kits through December 2027. The Proposed Agreement must be finalised prior to April 30, 2023, unless the parties agree to an extension, and all purchase commitments would be subject to the terms and conditions set forth in the final agreement.
The Tembo kits transform diesel-powered Toyota Land Cruiser and Hilux vehicles into ruggedised e-LVs for use in hard-to-decarbonise sectors. Alongside solar generation, battery storage, and on-site power distribution, Tembo e-LV products are a key component of VivoPower’s turnkey net-zero solutions for corporate decarbonisation.
Petrosea is a multi-disciplinary contract mining, engineering, procurement & construction, and oil & gas services company that is fully committed to prioritise ESG as a continuation of the company’s sustainability strategy. Petrosea offers complete pit-to-port mining solutions, integrated engineering, procurement, and construction capabilities as well as logistic support, whilst demonstrating absolute commitment to safety, health & environment, quality management, and business integrity.
VivoPower and Petrosea intend to finalise the Proposed Agreement as soon as practicable.
For more News & Insights, stay tuned to the VivoPower website.
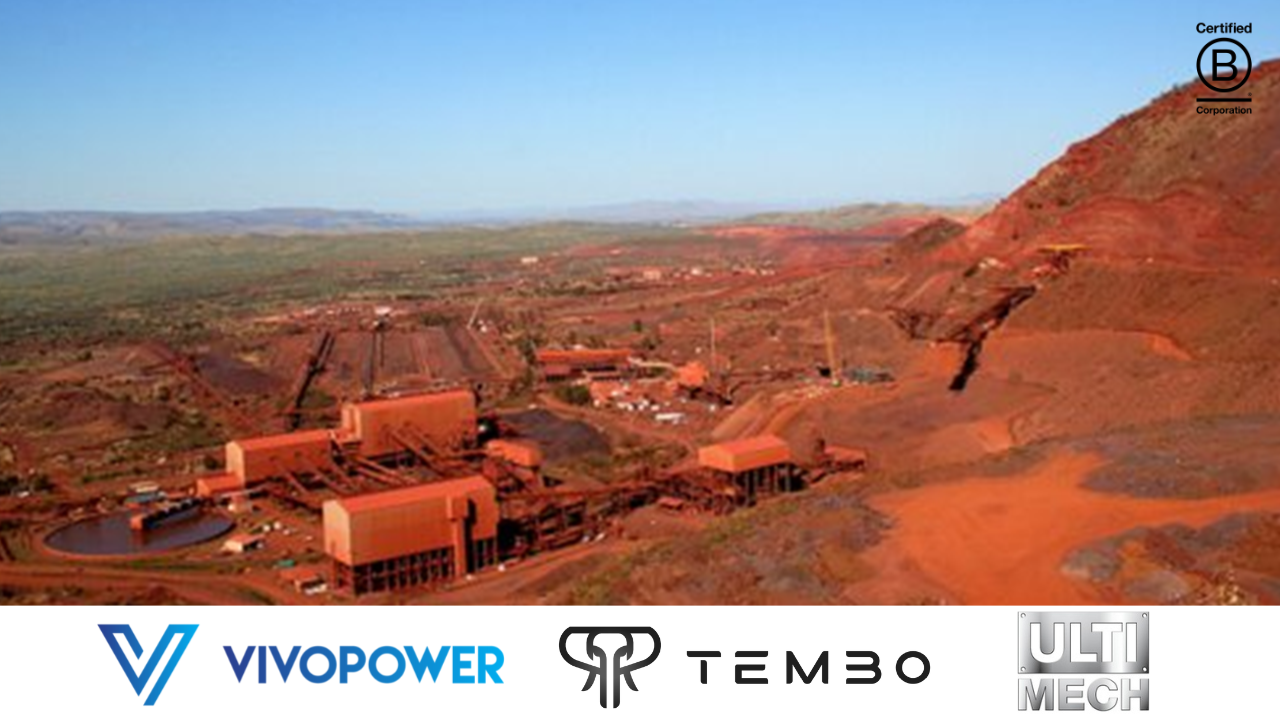
VivoPower International PLC is pleased to announce that it has signed a definitive agreement with Ulti-Mech for Ulti-Mech to market, distribute, and service Tembo-powered electric utility vehicles across Western Australia, home to half of Australia’s mines and the leading destination in the world for mining investment.
Ulti-Mech is a 100% Australian-owned and operated automotive service company headquartered in Newman, Western Australia. It has three locations enabling comprehensive coverage of Western Australia from north to south with plans to expand to two additional large mining towns in the Pilbara region, Tom Price and Karratha. The company provides specialised mining and 4WD automotive services through expert on-site advisors and highly qualified mechanics to leading large-cap mining companies and their contractors.
Under the Agreement, Ulti-Mech has committed to sell a minimum of 1,000 Tembo EV conversion kits from execution of this Agreement over the next 5 years across Western Australia. Ulti-Mech will be responsible for acquiring utility vehicles, converting the vehicles to ruggedised Electric Utility Vehicles (EUV) using Tembo conversion kits, selling the units to end-customers, and providing after-sale servicing and maintenance with support from Tembo.
The Tembo EV kits will transform new and second hand diesel-powered 4×4 LandCruiser and Hilux vehicles into ruggedised EUVs for use in the mining industry, as well as other sectors. Tembo EV conversion kits are a key component of VivoPower’s turnkey sustainable energy solutions, designed to help corporate customers accelerate towards their net zero carbon goals and to achieve cost savings.
Kevin Chin, VivoPower’s Executive Chairman and Chief Executive Officer said:
“Western Australia is one of the world’s largest mining markets and we have been seeking to partner with a well-established and highly reputed local leader in mine spec and 4WD automotive services. We are delighted to partner with Ulti-Mech and cater to its blue chip clientele, including some of the world’s pre-eminent mining companies. Ulti-Mech’s coverage across Western Australia is strategically important, given it is Australia’s largest state by land mass with mines located in remote locations from north to south. Importantly, Ulti-Mech is an Authorised Inspection Station service provider for the Department of Transport of Western Australia. We look forward to co-locating Tembo trained engineers across Western Australia, to support Ulti-Mech and its team to help its customers towards achieving their net zero objectives.”
John Adams, Ulti-Mech’s Founder and Managing Director said:
“I am thrilled to enter into a partnership with Tembo. With three locations in the heart of Western Australia’s mining market, we are perfectly placed to successfully supply and service the Tembo electric utility vehicle. With increased pressure for mining companies to start their Net-Zero journey, the Tembo solution is a significant step in that direction.”
About Ulti-Mech
Ulti-Mech is a 100% Australian-owned and operated company, first established in the Pilbara mining town of Newman in Western Australia. The company has over the years built a highly experienced team with specialised knowledge across a range of mining and 4WD automotive services. Ulti-Mech has expanded into the Perth metropolitan and Southern areas of Western Australia with three locations strategically located to provide coverage to its customers throughout Western Australia.
All trademarks referenced herein are the property of their respective owners.
Contact
Shareholder Enquiries
 We are happy to announce that we are Bronze Level winners in The Cleanie Awards 2022 for the Clean Energy Investment Leader of the Year.
The Cleanie Awards is the leading awards program dedicated to celebrating people and brands driving the clean energy economy.
Being acknowledged by The Cleanie Awards is evidence of Arowana's steadfast commitment to making a significant difference through clean energy investments.
Thank you to this year’s judges and the entire industry for recognising this incredible distinction.
We would also like to congratulate the Gold Level winners, Hannan Armstrong and Silver Level winners, SoCalGas RD&D.
To view the full list of winners, visit The Cleanie Awards website.
Stay tuned to Arowana for more News & Insights.
The Extended Producer Responsibility Act of 2022 is the latest and strongest attempt by the Philippines to curb plastic pollution. For years, the country has had to deal with high volumes of plastic waste. In fact, a World Bank report estimated that the Philippines produces approximately 2.7 million tons of plastics each year. About 20 percent of these materials make their way to the ocean.
Through the new law, the government hopes to reduce the number of plastics that end up in the environment. It enlists the help of large enterprises by making them more responsible for their own waste. This addresses the issue of plastic packaging waste directly through the source.
What is the EPR Act and how can it help solve the long-time problem of plastic waste in the Philippines? What responsibilities do businesses need to meet in order to adhere to the new law?

The Extended Producer Responsibility Act is a law that requires large companies to manage their own plastic packaging waste. Also known as Republic Act No. 11898, the legislation lapsed into law on 23 July 2022.
Under the EPRA, enterprises with over P1 billion worth of total assets must recover a specific portion of their waste. Failure to do so would land them a hefty fine from the Philippine government.
The new law is based on Extended Producer Responsibility, a concept first introduced by Swedish academic Thomas Lindhqvist in 1990. Lindhqvist outlined an environmental protection strategy where manufacturers take on the responsibility for the entire life cycle of their products. This includes the take-back, recycling, and final disposal of such products.
Many other countries have already developed EPR schemes that are designed to meet the unique challenges of their economies.
In North America, the United States and Canada have implemented the Product Stewardship Program. The initiative encourages manufacturers to re-design their products, change their marketing methods, and adopt innovative collection and recycling programs.
In Asia, Japan and South Korea were the first countries to adopt Extended Producer Responsibility frameworks. South Korean manufacturers and importers are required to pay an Advance Disposal Fee for products that are difficult to recycle.

The EPR Act framework aims to reduce the number of materials and wastes that end up in landfills. It tasks companies with finding new purposes for their products, whether through reuse or recycling. Those that can no longer be repurposed should be allowed to biodegrade without impacting the environment.
The law eschews the traditional ‘tingi-tingi’ system that is prevalent in the Philippines. It’s a common practice where manufacturers sell their products individually in disposable packaging. The system offers many cash-strapped Filipinos a more affordable and convenient way to buy basic goods. However, it leads to more single-use plastics being produced and ending up in landfills.
In place of the tingi-tingi system, the EPRA promotes the creation of product refilling systems for retailers. It also encourages product makers to add proper disposal labels to their offerings. This would help educate consumers on how to dispose of the product after use. It also allows companies to retrieve the items that they made.

The Philippines' EPR Act identifies plastic waste as a recovery requirement for enterprises. This means that any packaging made from synthetic material should be collected and properly handled by manufacturers.
Some of the most common forms of plastic packaging include:
There are several ways that companies can recover their plastic packaging wastes more responsibly, according to the EPRA. These include:
For large enterprises to adhere to the EPRA, they need to meet specific recovery rates in their waste management programs. These targets should be achieved within the timeframe outlined by the law.
Companies should:
The EPR Act requires companies to come up with their own EPR plan. They can also hire Producer Responsibility Organisations (PROs) to develop programs for them. A PRO is a group or firm that has extensive knowledge and experience in recycling, waste recovery, and reuse initiatives.
All EPR programs should be registered with the Department of Environment and Natural Resources via the National Solid Waste Commission (NSWC). This should be done within six months of the EPRA’s effectivity.
During registration, companies need to include key information such as:
The Philippine government tasks the NSWC with regulating the implementation of the EPR Act. A new sub-group, known as the National Ecology Center (NEC), was created to closely monitor how manufacturers follow the law. The office will be headed by the Environmental Management Bureau assistant director.
The NEC’s mandate includes the following:
To help promote the adoption of sustainable waste management, the EPR Act has outlined a reward system for relevant organisations. Manufacturers can apply for various tax incentives related to their EPR programs. These incentives will be made possible through the National Internal Revenue Code.
According to the law, all costs related to EPR activities will be considered “necessary expenses deductible from gross income”. However, the implementation is still subject to substantiation requirements under the Philippines' tax code.
Meanwhile, large enterprises that fail to meet the necessary recovery rates will face heavy fines from the government. The penalty could be equivalent to twice the amount of recovery and diversion of the plastic footprint or its shortfall. It could also be based on the list of fines set by the EPR Act, whichever is higher.
All cases of violations of the EPR Act will be handled by the DENR’s Pollution Adjudication Board. The body will be responsible for hearing and judging of cases, as well as imposing fines on violators.

While the concept behind the EPR Act is no longer new, not many organisations fully understand its purpose. There is still some misunderstanding as to what the Philippine government expects large enterprises to do. For the new law to work, this confusion needs to be addressed through the right dissemination of information.
At Arowana Impact Capital, we believe in the ideals of the Extended Producer Responsibility Act. The law provides a clear plan for cutting plastic pollution in the country. One important aspect to note is how companies stand to benefit from the EPR Act financially. By offering reasonable tax incentives, businesses will be more inclined to take care of the plastic waste that they produce.
The EPRA also highlights the role that producer responsibility organisations will play in the success of companies’ programs. PROs provide businesses with the knowledge and technical know-how to recover plastic packaging waste. This makes it possible for organisations to meet the law’s strict guidelines.
Green Antz, the cornerstone investment of AIC, is an example of a PRO that helps enterprises collect their plastic waste. The company operates several eco hubs where companies can drop off their plastic packaging. Green Antz transforms the recovered plastics into eco-bricks, which can be used to construct green buildings.
---
Market Study for Philippines: Plastics Circularity Opportunities and Barriers
https://www.worldbank.org/en/country/philippines/publication/market-study-for-philippines-plastics-circularity-opportunities-and-barriers-report-landing-page
The circular economy offers organisations a systematic way of solving some of the biggest problems of the world today. The economic model focusses on extending the value of existing raw materials and products to mitigate the impacts of materials extraction. It also prioritises the use of renewable energy over fossil fuels to help curb carbon emissions in many industries.
Far from being a recent invention, the concept of circularity has been around for a very long time. Societies have been experimenting with cycles and feedback loops in production for thousands of years. However, it was not until the advent of global crises, such as climate change and biodiversity loss, that CE solutions became widely accepted.
Now, more governments and businesses have started to adopt the circular economy approach. The future of many industries depends on how they can effectively use the finite resources available in the world.
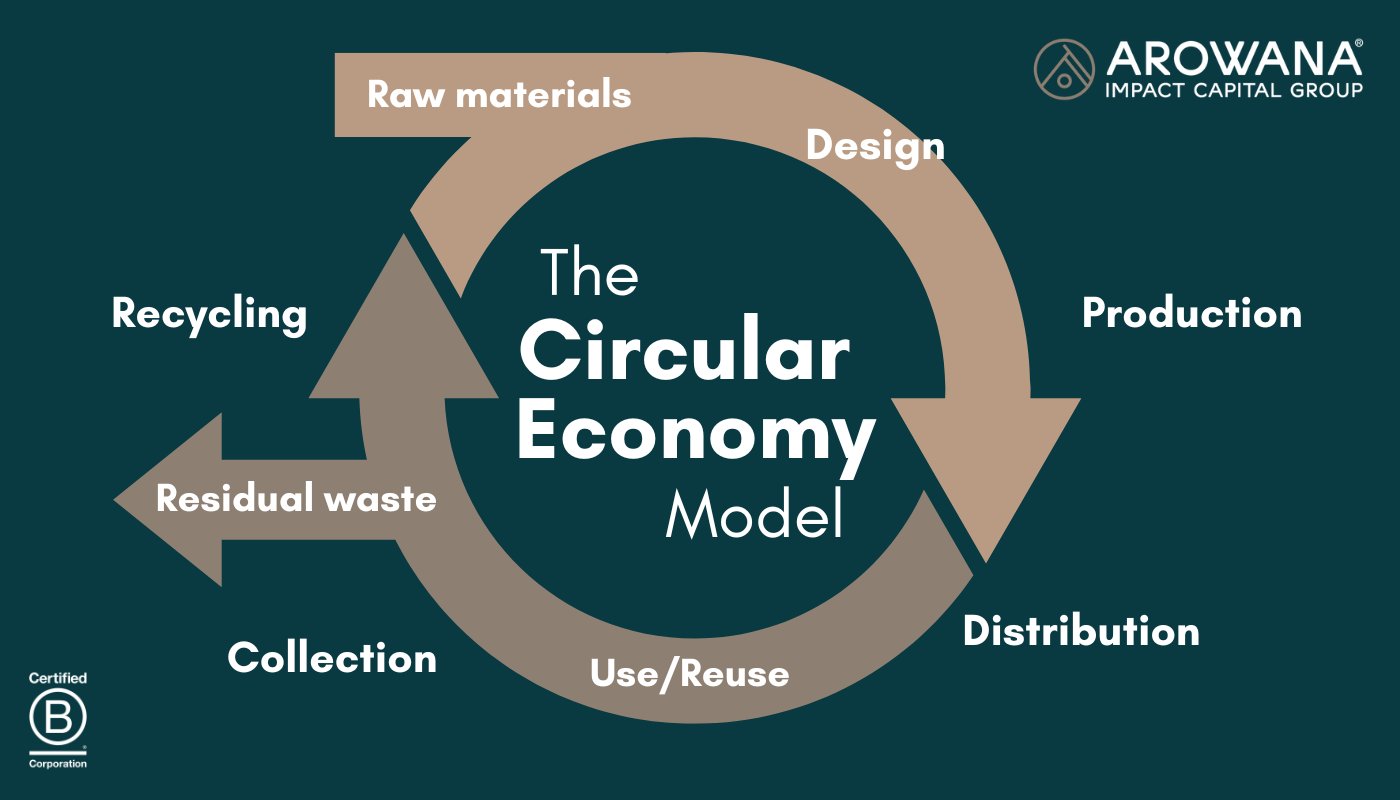
A circular economy (CE) is an economic system that makes use of restorative or regenerative industrial processes and economic activities. The objective is to preserve the value of raw materials, components, and products as much as possible. This is done through sharing, leasing, reusing, repairing, refurbishing, and recycling existing materials.
In a CE, manufacturers try to reduce waste to a minimum. When a product reaches its end of life, the materials used to make it are kept within the economy wherever possible. Further value is created by using the materials productively again and again.
Many organisations view the circular economy as a potential solution to global challenges. The Ellen McArthur Foundation, for example, believes it can provide society with the means to address biodiversity loss and climate change, while also tackling important social needs.
Researchers often point to three main elements that a circular economy needs to focus on to be effective: closed cycles, renewable energy, and systems thinking.
Circular economies place heavy emphasis on closing material cycles. During the manufacturing process, every residual stream is used to make a new product so that no waste is left. Residual flows are often segregated between biological and technical cycles. Toxic substances are also taken out of production.
In a CE, businesses take back the products from customers after use. This allows them to repair the used items and give them a new useful life. For this system to work, products, components, and raw materials should be kept in high quality.
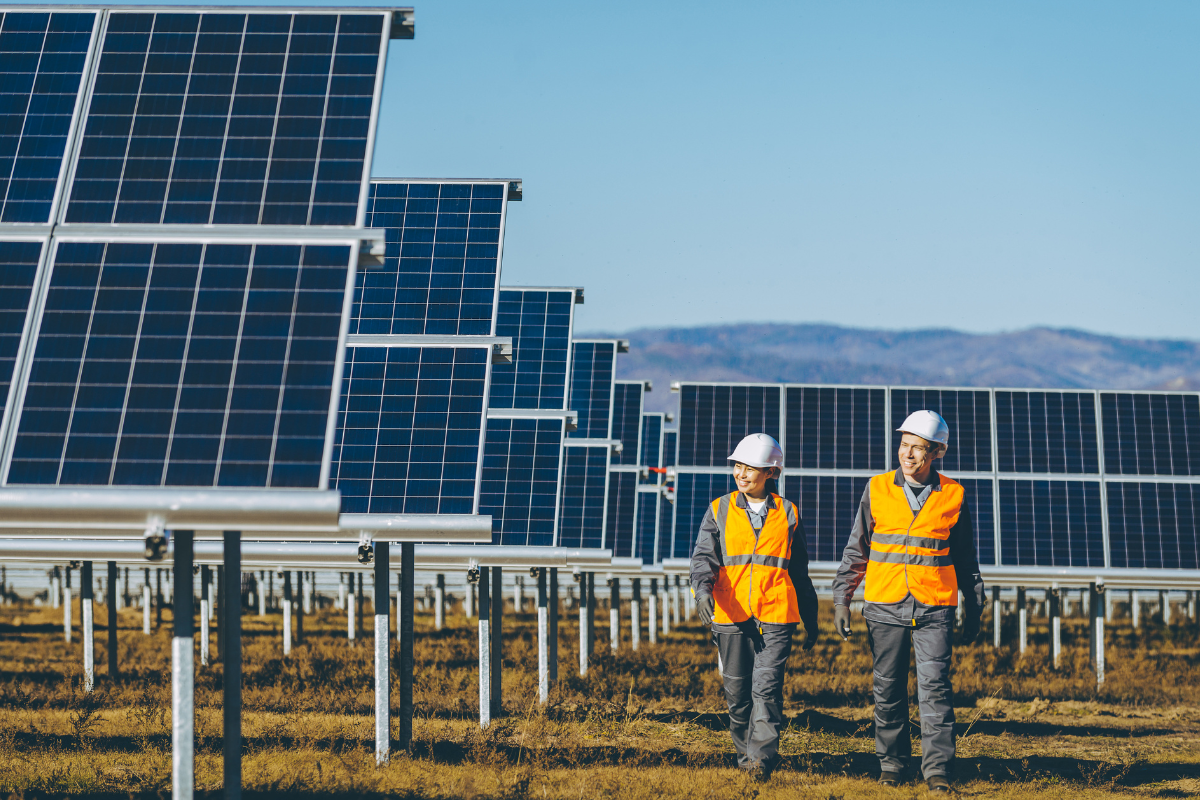
Another key element of circular economies is their use of renewable energy. Just like with raw materials, CE businesses prioritise extending the value of energy resources as well. This means sustainable power sources like solar, and wind are preferred over fossil fuels.
The concept of circularity can also be used in the production of renewable energy materials and equipment. By using existing materials within the economy, manufacturers can minimise the extraction of new raw materials. This, in turn, can help reduce the negative impacts of such activities on the climate, biodiversity, and society.
Systems thinking also plays a key role in the effectiveness of circular economies. Every person, company, and organism included in the system is connected to each other. This means every action that one stakeholder takes can affect other members of the network.
In a circular economy, every single decision should always consider its short-term and long-term consequences. Stakeholders should also factor in the potential impact of each action on the entirety of the value chain.
The concept of circular economy was developed as a more sustainable alternative to the traditional linear economy model.
In LE, manufacturers follow a “take-make-dispose” strategy where they collect raw materials and turn them into products. These products will be used until they reach their end of life and are discarded as waste. To create value, businesses would have to produce and sell as many products as they possibly can.
On the other hand, CE follows the 3R (reduce-reuse-recycle) strategy. Companies prioritise minimising the use of resources, maximising the reuse of products, and finding new uses for raw materials. Circular economy businesses focus on preserving the value of products instead of producing and selling as many as possible.
Circular and linear economies also have different approaches to sustainability. LE focusses on eco-efficiency, where the economic gain of production is maximised while also minising its environmental impact. By reducing the negative impact per economic profit gained, businesses can manage the potential overload of the system.
Meanwhile, CE focusses on enhancing the eco-effectivity of the system to achieve sustainability. By adopting radical innovations and system change, companies are able to maximise the positive impact of the system.
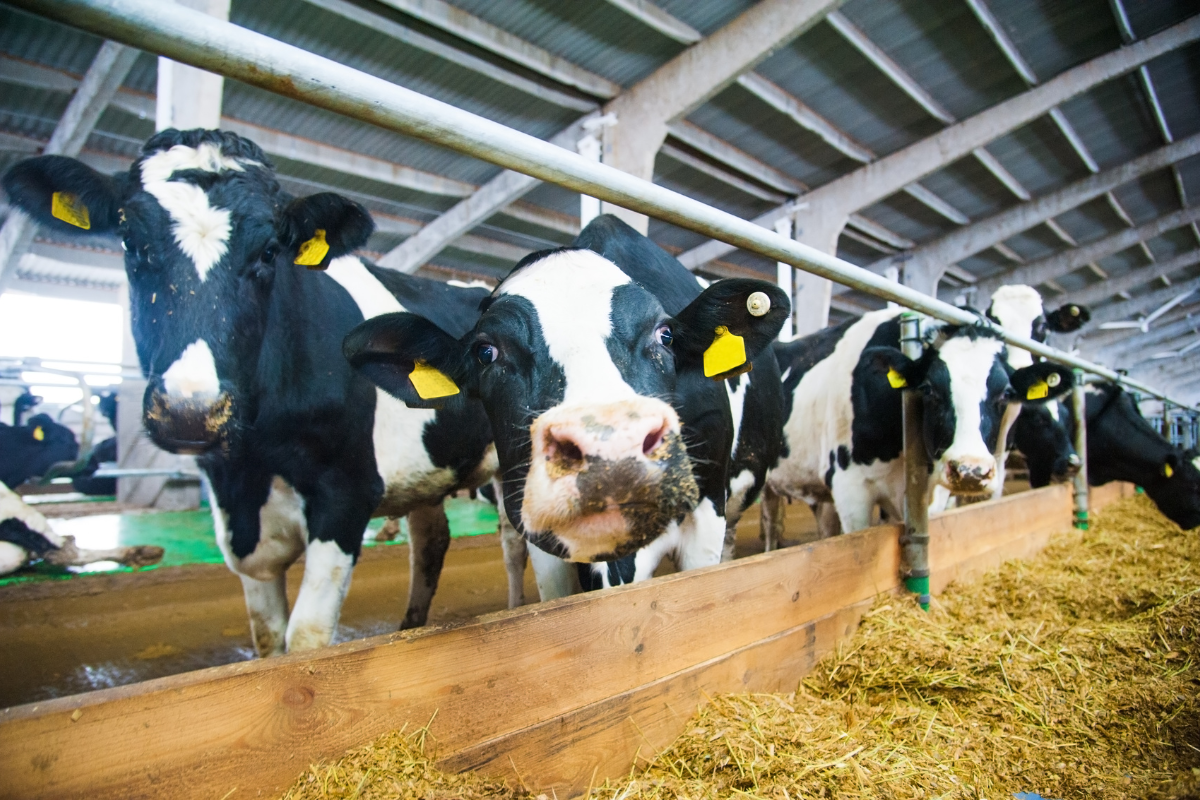
This difference between eco-efficiency (linear economy) and eco-effectivity (circular economy) can best be observed in the production of beef. One of the biggest challenges to raising cattle is the high levels of greenhouse gas (methane) emissions it produces.
To solve this issue, a linear economy would look at the way the cows are being fed and try to change it. Altering the type or amount of food the animals are given would allow cattle raisers to reduce methane emissions. This would essentially make beef production more eco-efficient.
However, a circular economy would address the GHG emission problem by not making beef from cows at all. Companies would rather develop a plant-based meat alternative that they can offer to consumers. By using plants instead of animal meat, CE businesses would help promote biodiversity, employment, and landscape management. This would make the ‘beef’ production eco-effective.

A circular economy offers several advantages to both companies and consumers, making an appealing production and economic model. These benefits can be divided into environmental, economic, and business.
With its strong focus on sustainability, circular economies prioritise the preservation of ecosystems and natural resources. One example is companies’ heavy emphasis on limiting their greenhouse gas emissions.
By using renewable energy instead of fossil fuels, manufacturers can cut the amount of GHG that they emit. It also improves production since renewables like solar and wind power are much more energy-efficient than petrol.
CE businesses also try to optimise their use of raw materials and agricultural productivity. Through reusing and dematerialising, companies can rely on fewer materials and processes to create products.
Switching to a circular economy model today can help organisations significantly reduce their overall carbon levels. A 2015 report found that CEs have the potential to halve their CO2 emissions by 2030, relative to 2018 levels. It showed a 48% reduction in emissions across mobility, food systems, and the built environment. This number could grow even further to 83% by 2050.
In the agriculture sector, the CE model can help improve the health and resilience of farmlands through composting. Farmers use anaerobic processes to ensure that important nutrients used in food production are returned to the soil. They also lower the number of residues that the farmers need to address to keep the soil viable.
Some circular economies have begun diversifying crops in their farmlands to improve soil health. This allows local insect populations to thrive, which also benefits other species that are part of local food chains.
Regenerative farming techniques such as these provide important habitats for microorganisms at the beginning of the food chain. They help hold more water in the soil, resulting in better fertility and productivity of farmlands.
The CE model’s focus on sustainable food and goods production also leads to better growth for economies overall. By eschewing the take-make-dispose strategy of the linear model, CEs can use and reuse natural capital more efficiently. They also find more value throughout the life cycle of existing products.
Many manufacturers still follow the linear economy model. Many of them assume that there will always be a constant supply of natural resources. However, the take-make-dispose mentality of LE businesses has led to severe natural resource depletion.
Ninety percent of global biodiversity loss and water stress are caused by resource extraction, according to the World Economic Forum. The practice also contributes to more than half of global climate change impacts.
The extraction and processing of metals and non-metallic minerals produce about 20% of greenhouse gas emissions. The production of plastics and other materials also adds to the increase in GHG levels. Current energy technology solutions can only do so much to mitigate these negative effects.
Circular economies develop smarter ways to use natural resources. By fully recycling raw materials used in production, it minimises the need to extract and process new resources. Recycling also cuts the number of materials that go to waste when they reach their end of life.
Transitioning to a circular economy model also creates better employment opportunities for workers. CE businesses are often in need of designers and engineers who can develop new ways of recycling and repairing materials. This focus on innovation also leads to the creation of new business models.
Additionally, a World Economic Forum report suggests that circular economies can bring greater local employment, particularly in entry-level and semi-skilled jobs. These jobs can help solve some of the economic problems that many developing countries face. However, these benefits depend on whether labour markets can be better organised and regulated.
Indeed, several international organisations are optimistic about the potential of CEs for employment generation. According to an International Institute for Sustainable Development (IISD) report, an estimated 3.9 million people found jobs because of the circular economy.
The International Labour Organization (ILO) believes 18 million green jobs can be created through the CE model by 2030. Meanwhile, Global Climate Action Summit projects that more than 65 million new low-carbon jobs by 2030.
A circular economy also leads to new profit opportunities. Businesses can increase their earnings by cutting their waste and energy costs through circularity. They can also improve the continuity of their supply.
Adopting circular methods can also help companies enter new markets that would not have been available had they still been in a linear economy.
For manufacturers, making sure that they receive a steady supply of raw materials is of the utmost importance. Without these, they wouldn’t be able to produce products to meet the demand.
However, several factors make it difficult for many businesses to secure their supplies. The availability of raw materials often drives up prices, making them highly volatile to depend on. Natural calamities and geopolitical crises can also severely affect supply chains.
Instead of relying on the procurement of new raw materials, CE businesses address the supply issue by cutting the number of materials they use overall. They create products made from recycled or reused materials instead. This reduces their dependence on volatile raw material prices.
Ultimately, the circular economy model helps companies become more resilient against disruptions in supplies.
With the CE model opening up new business opportunities, companies will need to create additional services to meet the demand. The Ellen McArthur Foundation outlines three examples of these new services:
The report explained that specialised knowledge involves the collection, disassembly, refurbishment of products, integration into the manufacturing process, and introduction of the products to the market.
In many cases, companies can adopt these new services by creating subsidiaries.

Despite the numerous benefits of a circular economy, many countries have yet to adopt this economic model. Businesses face several challenges that prevent them from switching their production strategy.
According to the World Economic Forum, there are 5 main barriers against the circular approach.
Many businesses still don’t have enough knowledge about available CE solutions or how to apply them. Some may already have the know-how but don’t necessarily have the competencies to implement such strategies.
Another challenge is the absence of a circular mindset in business owners. Many companies still view post-consumer products as mere waste. There are also those that don’t consider the sake of other stakeholders beyond their immediate customer base.
CE adoption is also hampered by the refusal of some businesses to even consider the potential of the model for innovation.
Unfortunately, only a few companies appreciate the financial benefits of switching to a circular economy. There are businesses who flat-out refuse to invest in CE solutions that would cost more than what the organisations could afford.
Some companies also believe that they might lose their competitive edge if they were to switch to a different market.
For bigger companies, adopting a CE model may not be that difficult since they could easily shift to recycled or reused materials. However, this might not be as simple for smaller manufacturers that rely heavily on certain raw materials.
Recycled or reused materials or components are still not yet readily available on the market. This makes it harder for companies to source enough materials for their production. Those that are available might not meet the right quality or are far too expensive for manufacturers.
There are also several other factors that keep companies from adopting circular approaches. Business owners are uncertain about the stability of regulations (such as carbon tax), as well as the viability of CE-related technologies (such as components reuse).
Some companies are also unsure whether customers would be willing to accept a switch to a circular economy. CE solutions cannot always be used as an alternative to non-CE practices since they don’t necessarily have the same quality or price level. This financial uncertainty leads many business owners to be wary of changing from a linear to a circular model.
Switching to a circular economy requires a significant change in consumer behaviour. It will make it difficult for people to buy into the CE model if they would have to put in more effort in doing so.
Also, not all companies can shoulder the high operating cost involved in implementing CE approaches. This can discourage even those who might be convinced of the potential benefits of these solutions.
There is also a need to create market-wide standards in implementing circular economy approaches. Some solutions, such as the reduction of material variation, can only effectively improve circularity if many companies in a given market adopt the measure.

Throughout the years, the circular economy model has been adopted in different industries. Companies have found various innovative ways on how to apply circularity in their businesses.
Some clothing brands have started leasing their products instead of selling them. The approach builds on the concept of ‘sharing economy’, where access and services are prioritised over ownership. This allows the manufacturer to retain ownership of their products and keep the items within their production cycle.
For these companies, they take on the role of the manufacturer and recycler of the products. Not only does it extend their own responsibility for the items, but it also lets them produce more circular clothing.
Circularity in clothing is viewed as a significant step toward reducing waste. The UN Conference on Trade and Development (UNCTAD) identified the fashion industry as the second most polluting in the world.
The consumer tech industry is also adopting the CE model by offering leasing services for mobile devices. Some telecom companies allow customers to lease mobile phones instead of buying them.
The circular service lets the company keep a closed cycle for the recycling and reuse of products. More than 99% of mobile phones are returned. About 95% of these devices are then either repaired and reused or recycled by the telecom company. This allows the industry to cut as much as 50kg of carbon dioxide for each mobile device saved.
Single-use plastics have also been a particular concern in terms of waste management. To address the problem, several restaurants have started using environmentally friendly containers for food items. These include cardboard packaging, cloth bags, and even recycled containers that were once used for another product.
Some food stores have switched to using biodegradable utensils and even tried using edible cups, straws, and plates.

In the construction industry, more businesses around the world are now incorporating reused or recycled items in materials. Some have developed new technologies that use recovered plastics to produce eco-bricks. This helps reduce the number of plastic waste that could end up overcrowding landfills.
One example of this is Green Antz Builders, an environmental solutions company in the Philippines. Green Antz collects used plastics and turns them into eco-friendly construction materials. The company has also tapped local businesses and communities to donate their plastic waste, such as beverage bottles, tarpaulins, and CDs/DVDs.
Despite the potential of the circular economy to solve many of the world’s problems, it still suffers from the same limitations as other economic models. Its solutions can only be fully effective if a large portion of society adopts and implements them.
Every stakeholder in the economy needs to do their part to maximise the value of finite resources and reduce the production of waste. Circularity, in this sense, can only work if every single link is connected.
For more information on the circular economy, visit the Arowana Impact Capital website.

We are humbled to announce that Arowana has once again made it to the prestigious list. This year, we ranked as the 35th-best purpose-driven business globally and the best in #ImpactInvesting for 2023.
For Arowana, this is the 4th straight year we have been honoured to be part of the Impact Awards. We debuted on the list in 2020, and since then, we have consistently ranked in the top 50 global companies despite the growing list of entries every year.
Founded in 2010, Real Leaders is a membership community for impact leaders powered by a global media platform. Its mission is to unite farsighted leaders to transform our short-sighted world.
Now in its 5th year, the Real Leaders Impact Awards honour companies that are driving positive impact while achieving impressive business growth. Driven by a proprietary ‘Force for Good’ score, the Impact Awards takes into account the 5-year sales growth, revenue, and B Impact Assessment (or default score) while ranking the companies.
This latest recognition shows Arowana's dedication to creating a meaningful impact in the community through our business. Our primary purpose continues to be to deliver the #BCorp triple bottom line of People, Planet, and Profit, and we are proud to have been recognised again by Real Leaders for our commitment to this purpose.
Visit the Real Leaders website to view the full list of 2023 Impact Awards winners.
Stay tuned to Arowana for more News & Insights.

EdventureCo, the education platform of award-winning impact investment firm and global B Corp, Arowana, announced that DDLS Group has rebranded to Lumify Group, uniting all its digital training brands under one umbrella.
A long-time leader in corporate ICT and digital skills training in Australasia, DDLS has continued to expand its services into new industries and regions. The group recently acquired Auldhouse, New Zealand’s largest ICT training provider, and Nexacu, Australia's leading provider of Microsoft end-user training. It launched the Australian Institute of ICT (AIICT), an online learning business, and opened its DDLS Philippines campus. DDLS People, the company’s business consultancy arm, also experienced significant growth over the past few recent years. These separate business divisions will now be consolidated under Lumify Group.
Under the new structure, Lumify Group will serve as the overarching brand for the businesses and incorporate the introduction of Lumify Learn, Lumify Work, and Lumify People. DDLS Australia, DDLS Philippines, and Auldhouse will now be known collectively as Lumify Work; DDLS People will now be known as Lumify People; and Lumify Learn will be launched in the new year, as its all-new ICT Consumer training arm.
The rebrand addresses two main objectives for DDLS. The first is to unify its business units under a single brand architecture. The second is to allow the company to focus on its mission to narrow the digital skills gap by equipping the workforce with future-focused, in-demand skills.
“The existing DDLS brand doesn’t do justice to the progressive, modern organisation we’ve become. While it has equity with our existing customer base, the name itself has no connection to what we do as a business,” Lumify Group CEO Jon Lang said.
“To move forward and continue to dominate the ICT training market in Australasia, we needed to move our separate brands under one umbrella. The rebrand is an important milestone for us and reflects our ongoing commitment to closing the digital skills gap across the APAC region by providing world-class training to our future tech workforce. In Australia alone, 286,000 people will need to enter technology jobs over the next four years just to keep pace with growth. Lumify Group’s ultimate mission is to meet this demand, by giving people and businesses the skills they need to flourish in a future where technology rules.”
“The next few years will see us continue to expand into other regions, target new markets, and increase our investment in digital, flexible, and customer-focused delivery and courses.”
The new name ‘Lumify’ means to illuminate; chosen to reflect Lumify Group’s belief in the power of learning and its ability to enlighten and transform.
“We wanted to design a modern, digital-first brand identity that communicates who we are now- and where we are headed. With so much growth and expansion, we felt the time was right to unite all our different brands and services under a single brand. But to do that, we realised we needed a new name. A name that truly reflects who we are, what we’ve become, and where we’re headed,” Lumify Group Marketing Head Michael Crump said.
The rebrand comes at a time when the company delivers an extensive and varied portfolio of 600+ courses to more than 30,000 students annually across 90 classrooms, along with a growing range of virtual and self-paced online options. It will have no impact on the day-to-day operations of all business units or the student experience.
For more information, please watch the Lumify Group Video here, and visit the website at http://www.lumifygroup.com/.
Stay tuned to the Arowana website for more news & insights.
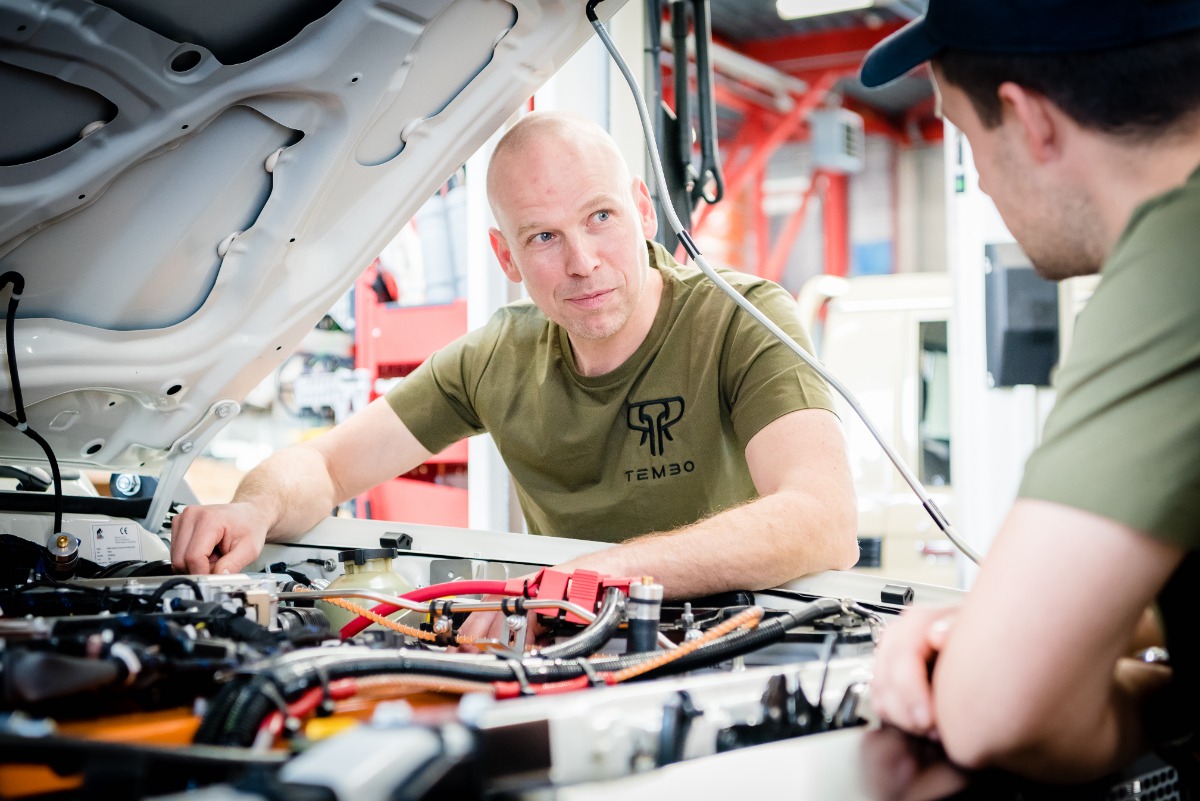
Ruggedised EV conversion specialist Tembo e-LV has today revealed its new logo and website temboelv.com.
A wholly owned business of VivoPower, an award-winning global sustainable energy solutions company, Tembo specialises in the design and assembly of electric vehicle (EV) conversion kits for light utility vehicles in on-road and off-road applications. The company started offering its EV conversion kits for new vehicles and recently announced its entry into the second-hand market, a much larger total addressable market.
The new logo evolves Tembo’s classic elephant badge to reflect the reliability and power of the vehicles and has been modernised by creating an image of the elephant’s head, facing head-on, replacing the previous silhouette profile image.
The logo image is a stylised African Elephant, in keeping with its roots in ruggedisation for 4×4 utility vehicles, while the modernisation better represents the advanced technological and engineering capabilities of the company. A new wordmark has also been introduced to translate the company’s spirit of innovation.
The rebrand was led by a dedicated internal team in consultation with international branding experts and Tembo’s Leadership team. In addition to the new logo and livery, the rebrand coincides with a new look website which features a clear story on the Homepage with more compelling content, a Partners page – showing Tembo’s distribution presence in 50+ countries – and Tembo Academy page – where users can browse through a new curriculum of in-person courses geared to end-users and partners.

Visit the VivoPower website for more News & Insights.
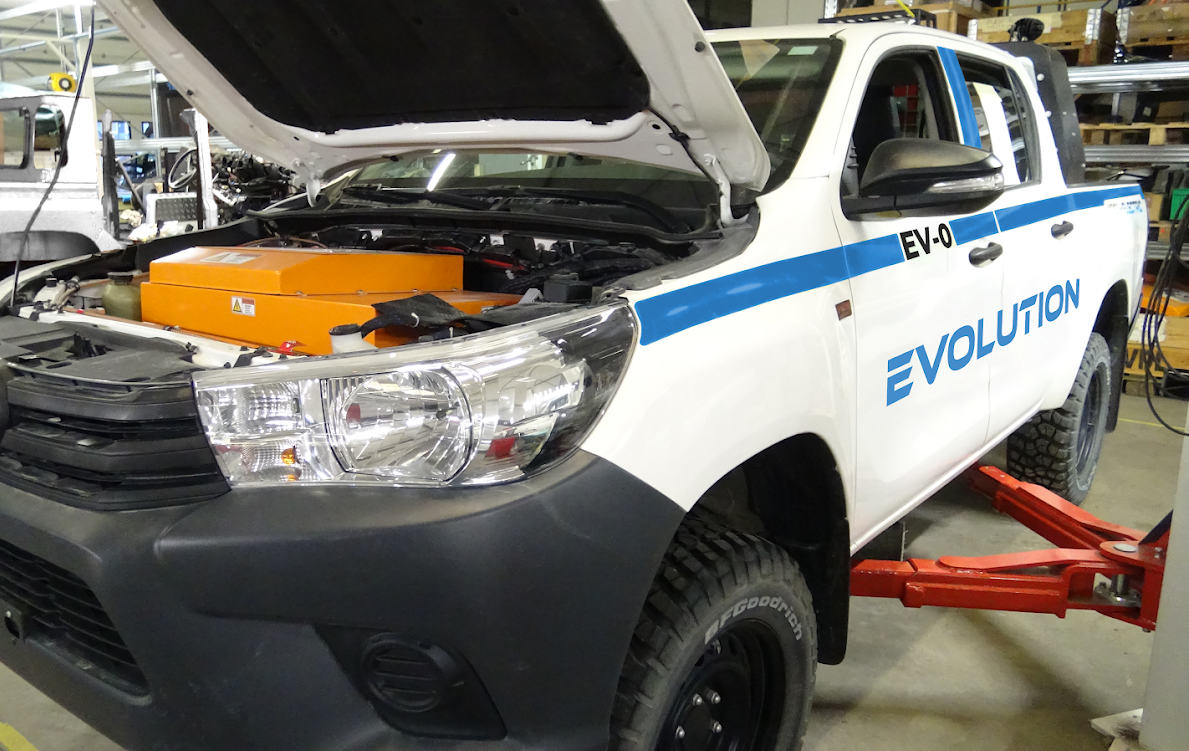
VivoPower is pleased to announce that the Company and its wholly-owned subsidiary, Tembo EV Australia Pty Ltd (“Tembo Australia”), have entered into a Supply Agreement with the Evolution Group Holdings Limited (“EGH”, “Evolution”) for the full electrification of its fleet of light utility vehicles for traffic management and fleet management. Under the definitive agreement, Tembo Australia will convert existing and new vehicles to full electric over the next 5 years, subject to the successful completion of commercial and technical on-road trials, with a target to have the first fully electrified utility vehicle certified and roadworthy in 2023.
Kerry Daly, Non-Executive Chairman of Evolution, said: “Evolution is constantly evaluating opportunities to offer innovative and competitive solutions to its clients and to the industry as a whole. We have one of the largest fleets of vehicles for traffic management services across Australia and New Zealand and being the first to commit fully to the electrification of our vehicles will help to set new eco-friendly standards for the industry. After a review of proposals and capabilities of different electric vehicle conversion companies, the independent board members of Evolution have selected Tembo on the basis of their global experience, capability to deliver, training, and change management credentials as well as the broader VivoPower sustainable energy solutions offering.”
Evolution will be the first traffic management company in the world to commit to fleet electrification and repowering, which is in keeping with its objective to deliver cost-effective, sustainable, and environment-friendly solutions for clients from both the private and public sectors in Australia and New Zealand.
Gary Challinor, Chief Operating Officer of VivoPower, said: “We are delighted to have been selected for this important agreement and partnership to repower Evolution’s fleet of light utility vehicles for traffic control and fleet management. It is a first for the repowering of an existing fleet in Australia and New Zealand and also a first for the traffic management sector. We are looking forward to working closely with Evolution, not only to provide conversion EV powertrain kits, ruggedisation and customisation, but also importantly to deliver training and change management, as well as complementary sustainable energy solutions”. Sharing some company expansion plans on the occasion, he added: “Tembo is currently evaluating options and in discussions with financiers for establishing assembly facilities in Australia and is considering South East Queensland as a preferred location.”
To read the full article, and to keep up with all releases, visit VivoPower’s Press Releases page.
About Evolution Group Holdings
Founded in 2004 and headquartered in Brisbane, Australia, Evolution Group Holdings Limited (EGH) is one of the largest non-government providers of road infrastructure services across Australia and New Zealand, including traffic planning, traffic control, traffic management, training, equipment hire, fleet maintenance and management, and road corridor civil & bridge maintenance. The company has an extensive specialised fleet of over 500 vehicles for its traffic management and fleet management services and has an employee base of over 700 personnel across Australia, New Zealand and the Philippines.